e.maps >

Internet Mapping Project & World Web Maps

  • Twitter
  • Facebook
  • LinkedIn
  • Instagram
  • YouTube
  • Map projections
  • Social Maps
  • Web maps
  • ecolors
  • contact
  • Fault lines

    3 avril 2025

    Fractures

    Following on from his series Geopolitics of Chaos, Marcel Robert is offering a new series of variations on contemporary fault lines via the e.maps website. Exhibition at 365Galerie.

    A la suite de sa série Géopolitique du chaos, Marcel Robert propose via le site e.maps une nouvelle série de variations sur les lignes de fracture contemporaines. Exposition à la 365Galerie. (suite…)

  • Trump’s World Map

    31 mars 2025

    Trump's World Map

    Donald Trump is trying to take over the world, or at least it seems he would like to. Trump’s rise to power comes at an unsettled time around the world. Across the globe, regional and powers have been making troubling attempts to expand their influence – either through soft control, or more old fashioned land grabs. Now, after decades of ‘soft-power empire’ it seems the leader of the US and his close allies have started thinking along the same lines, using his voice to to make comments – some seemingly jokes, others not – to tell the world which places he would like to hoist the the Star-Spangled Banner over. Enter the era of the American imperial dream.

    Download Donald Trump’s World Map (jpg format, 2 Mo)

    Prints available on request at 365Galerie

  • Global Change

    28 mars 2025

    Global Change Map

    Global change in broad sense refers to planetary-scale changes in the Earth system. It is most commonly used to encompass the variety of changes connected to the rapid increase in human activities which started around mid-20th century, i.e., the Great Acceleration. While the concept stems from research on the climate change, it is used to adopt a more holistic view of the observed changes. Global change refers to the changes of the Earth system, treated in its entirety with interacting physicochemical and biological components as well as the impact human societies have on the components and vice versa.

    Download Global Change maps (jpg format, 174 Ko)

    Prints available on request at 365Galerie

  • Carte du Budget militaire

    24 mars 2025

    Carte du Budget militaire

    La carte du Budget militaire 2023 représente les dépenses militaires par pays pour l’année 2023 à partir des données fournies par la Banque mondiale / The Military Budget 2023 map shows military expenditure by country for the year 2023, based on data provided by the World Bank.

    Télécharger la carte du Budget militaire 2023 (jpg format, 647 Ko)

    Source: Marcel Robert 2025

  • Géopolitique du chaos

    21 mars 2025

    Géopolitique du chaos

    A l’occasion du conflit russo-ukrainien et de l’arrivée au pouvoir de Donald Trump aux Etats-Unis, Marcel Robert propose une relecture cartographique du monde en phase de recomposition. Tirages disponibles sur demande sur le site de la 365Galerie.

    On the occasion of the Russian-Ukrainian conflict and Donald Trump’s rise to power in the United States, Marcel Robert offers a cartographic rereading of the world in a phase of recomposition. Prints available on request from the 365Galerie website. (suite…)

  • World Web Map

    13 août 2007

    World Web Map

    The World Web Map is based on the 2007 websites world classification carried out by Alexa and ComScore. The websites traffic is correlated with the surface of the countries. Search your preferred website !

    Download World Web Map 2007 (Pdf format, 47 Ko)

    Download World Web Map 2007 (jpeg format, 448 Ko)

    (suite…)

  • Carte mondiale du Web

    13 août 2007

    Carte mondiale du Web

    La carte est basée sur le classement mondial des sites Internet réalisé par Alexa et ComScore. Le trafic des sites Internet est corrélé avec la surface des pays. Cherchez sur la carte votre site Internet préféré ! (suite…)

  • World Instability Map

    13 août 2007

    World Instability Map

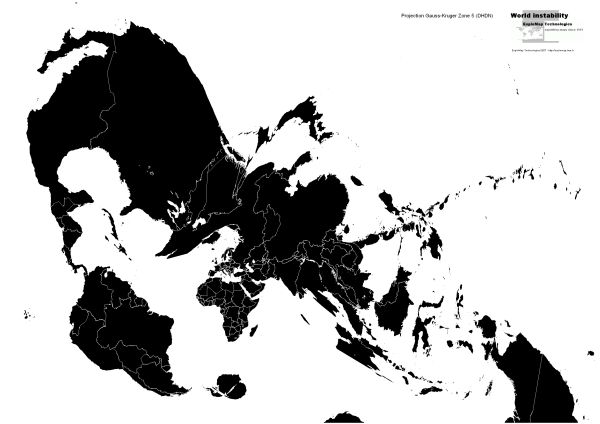
    Projection Gauss-Kruger Zone 5 (DHDN)

    A system using Transverse Mercator projections to map the world into numerous standard zones that are six degrees wide. The standard Gauss-Kruger projection is also known as the Pulkovo 1942 Gauss-Kruger projection.

    Americans can best understand the Gauss Kruger system by thinking of it as a version of the Universal Transverse Mercator (UTM) system with zones defined for European and Asian coverage. (Europeans, of course, can think of the UTM system as a version of the Gauss Kruger system that has been implemented by Americans.)

    Like UTM or the State Plane Coordinate System, the Gauss Kruger system of projections is a living fossil. It was created mostly as a reflection of the technological limitations of an earlier era. When used with skill as originally intended it still functions well in expert hands. The problem with the Gauss Kruger system (as with UTM or the State Plane) is that it is constantly misused in civil applications by inexpert users who do not realize the limitations built into the system.

    Download World Instability Map (Jpeg format, 636 Ko)

    Télécharger la carte de l’instabilité mondiale (Jpeg format, 636 Ko)

  • Carte de l’instabilité mondiale

    13 août 2007

    Carte de l'instabilité mondiale

    Télécharger la carte de l’instabilité mondiale (Jpeg format, 636 Ko)

  • Internet Users Map

    13 août 2007

    Internet Users Map

    This map is based on the Internet users classification carried out by Clickz.

    Download Internet Users Map 2005 (Pdf format, 1,6 Mo)

    Télécharger la carte des utilisateurs d’Internet en 2005 (Pdf format, 1,6 Mo)

  • Carte des utilisateurs d’Internet

    13 août 2007

    Carte des utilisateurs d'Internet

    La carte est basée sur le classement des utilisateurs Internet réalisé par Clickz.

    Télécharger la carte des utilisateurs d’Internet en 2005 (Pdf format, 1,6 Mo)

  • Human Development Map

    13 août 2007

    Human Development Map

    The Human Development Index (HDI) provides a composite measure of three dimensions of human development: living a long and healthy life (measured by life expectancy), being educated (measured by adult literacy and enrolment at the primary, secondary and tertiary level) and having a decent standard of living (measured by purchasing power parity, PPP, income).

    Download Human Development Map (Pdf format, 1,6 Mo)

    Human Developmentes Index (HDI) is a comparative measure of life expectancy, literacy, education, and standard of living for countries worldwide. It is a standard means of measuring well-being, especially child welfare. It is used to determine and indicate whether a country is a developed, developing, or underdeveloped country and also to measure the impact of economic policies on quality of life.

    Source: http://en.wikipedia.org/wiki/Human_Development_Index

  • Carte du développement humain

    13 août 2007

    Carte du développement humain

    L’Indicateur du Développement Humain (IDH) est un indice de mesure composite faisant intervenir trois dimensions du développement humain : la longévité et la santé (mesurées par l’espérance de vie), l’instruction (mesurée par l’alphabétisation des adultes et la scolarisation au niveau primaire, secondaire et supérieur) et un niveau de vie décent (mesuré par le revenu en parité de pouvoir d’achat (PPA).

    Télécharger la carte du développement humain (Pdf format, 1,6 Mo)

Designed by MRProd with WordPress